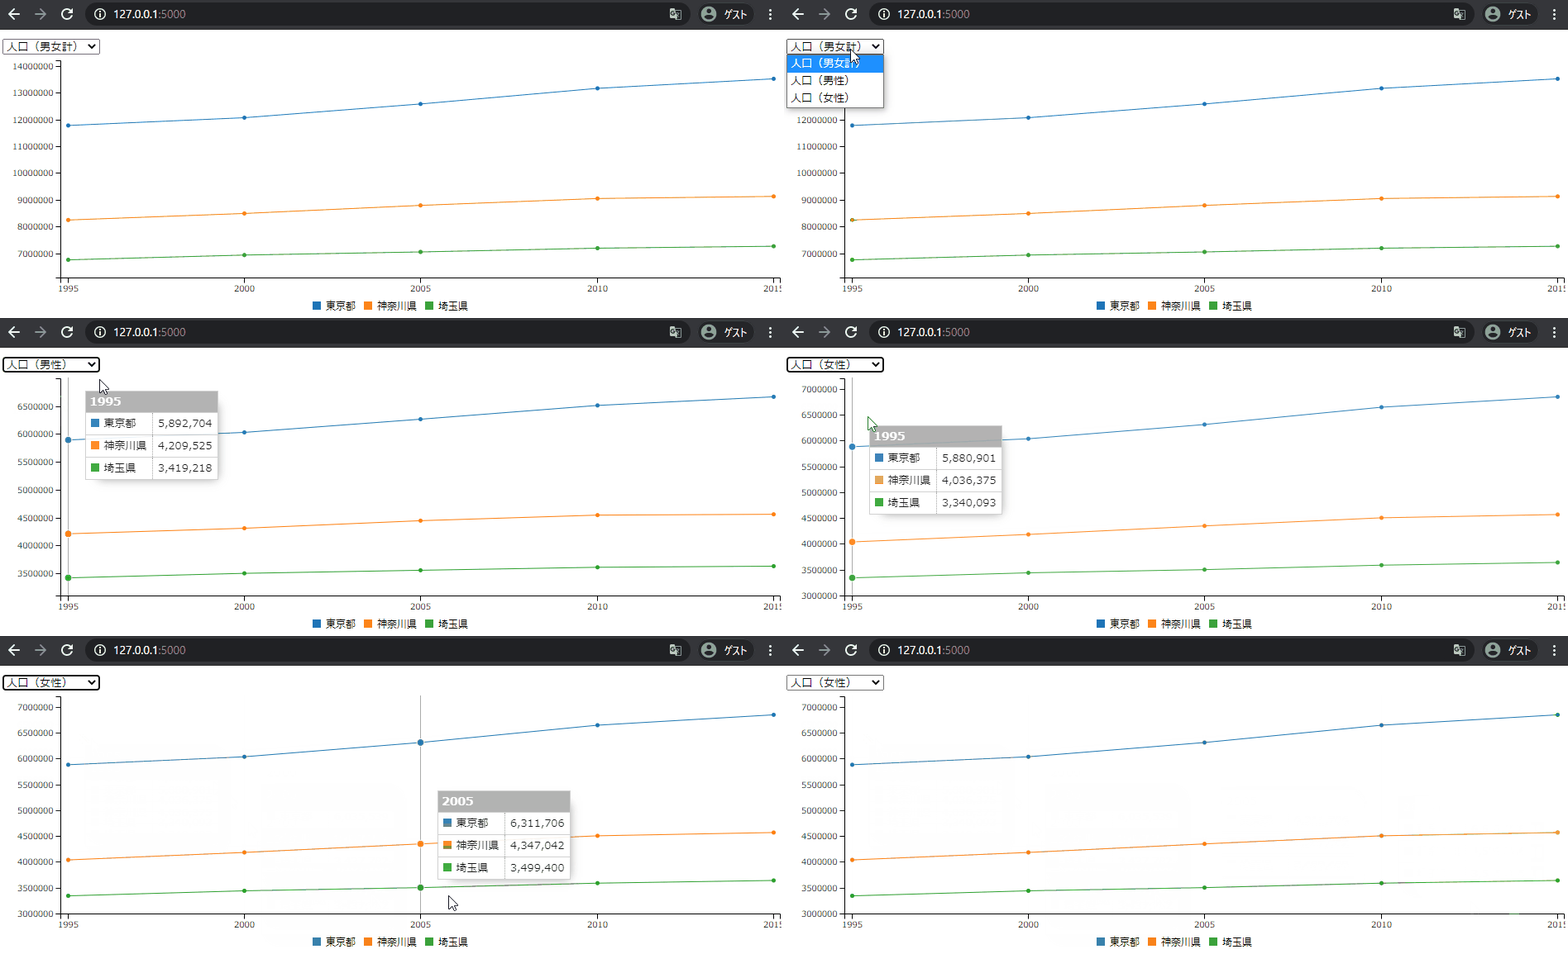
FlaskとjQueryとsqliteについて少し勉強したのでメモ。
シンプルな例
まず、シンプルに文字を書き換えるだけの場合について。

バックエンド
flaskでサーバー側の処理を書きます。
ページを表示するための index() と、フロントエンドからのAjax通信に対して受け答えするための show() の2つのメソッドを用意します。
# app.py
from flask import Flask, render_template, jsonify, request
import json
app = Flask(__name__)

# トップページにアクセスされたらindex.htmlを表示する
@app.route('/')
def index():
    return render_template("index.html")

# /showにPOSTリクエストが送られたら処理してJSONを返す
@app.route('/show', methods=['POST'])
def show():
    return_json = {
        "message": f"Hello, {request.form['username']}"
    }
    return jsonify(values=json.dumps(return_json))


if __name__ == '__main__':
    app.run(debug=True)
フロントエンド
入力フォームを用意しておいて、入力値に変更があるたびにajaxでサーバーにPOSTリクエストを送るようにしておきます。
<!-- templates/index.html -->
<!DOCTYPE html>
<html lang="en">
<head>
    <meta charset="UTF-8">
    <meta name="viewport" content="width=device-width, initial-scale=1.0">
    <title>Example</title>
    <script src="https://code.jquery.com/jquery-3.5.1.min.js" integrity="sha256-9/aliU8dGd2tb6OSsuzixeV4y/faTqgFtohetphbbj0=" crossorigin="anonymous"></script>
</head>
<body>
    <h1 id="midashi">Hello</h1>
    <!-- フォームに値を入れても遷移しないようにするため、onsubmitにfalseを返す -->
    <form name="example_form" onsubmit="return false;">
      <!-- 入力値の変更があったらJSの関数を実行する -->
      <input type="text" name="username" placeholder="Write your name" onchange="changeHandler(this)">
    </form>
    <script>
      function changeHandler(input_value) {
        const username = $(input_value).serialize();
        $.ajax("/show", {
              type: "post",
              data: username,  // POSTでサーバーに送信するデータ
              dataType: "json",
            }).done(function(data) { // 成功した場合実行される
              console.log("Ajax通信 成功");

              // POSTリクエストの結果を受け取ってHTMLを書き換える
              const message = JSON.parse(data.values).message
              // document.getElementById("midashi").innerHTML = message; と同義
              $("#midashi").html(message);

            }).fail(function(data) { // 失敗した場合実行される
              console.log("Ajax通信 失敗");
        });
      }
    </script>
</body>
</html>
グラフを書き換える
次に、記事冒頭のやつを作る場合について。

バックエンド
DBに入っているデータを取り出してグラフを描く感じの想定で、sqlite3を使ってみます
グラフはC3.jsを使い、python側でやる処理は描画のためのデータをフロントに渡すだけです
import sqlite3
from flask import Flask, render_template, jsonify, request, g
import json
app = Flask(__name__)
DATABASE = "./example.db"


@app.route("/")
def index():
    cur = get_db().cursor()
    populations = get_data_as_wide(cur, col="population")
    # C3.js用のデータを作る
    default_value = {
        "bindto": "#chart",
        "data": {
            "rows": populations,
            "x": "year"
        },
        "axis": {
            "y": {}
        }
    }
    return render_template("index.html", default_value=default_value)


@app.route("/show", methods=["POST"])
def show():
    variable = request.form['variable']
    cur = get_db().cursor()
    populations = get_data_as_wide(cur, col=variable)
    new_value = {
        "bindto": "#chart",
        "data": {
            "rows": populations,
            "x": "year"
        },
        "axis": {
            "y": {}
        }
    }
    return jsonify(values=json.dumps(new_value))


def get_db():
    db = getattr(g, '_database', None)
    if db is None:
        db = g._database = sqlite3.connect(DATABASE)
    return db


def get_data_as_wide(cur, col):
    """データを横持ちで取得する"""
    query = f"""
    SELECT
        year,
        max(CASE WHEN prefecture = '東京都' THEN {col} END) AS "東京都",
        max(CASE WHEN prefecture = '神奈川県' THEN {col} END) AS "神奈川県",
        max(CASE WHEN prefecture = '埼玉県' THEN {col} END) AS "埼玉県"
    FROM populations
    GROUP BY year
    """
    rows = cur.execute(query).fetchall()
    header = ["year", "東京都", "神奈川県", "埼玉県"]
    populations = [header] + [list(row_tuple) for row_tuple in rows]
    return populations


def setup_database():
    """データベースを作っておく"""
    # ※.dbファイルが無くても作られるので問題ない
    con = sqlite3.connect(DATABASE)
    cur = con.cursor()
    cur.execute("DROP TABLE IF EXISTS populations")
    cur.execute("""
    CREATE TABLE populations
    (prefecture text, year integer, population integer, population_male integer, population_female integer)
    """)
    # 国勢調査の人口データ
    populations = [
        ('埼玉県', 1995,  6759311, 3419218, 3340093),
        ('東京都', 1995, 11773605, 5892704, 5880901),
        ('神奈川県', 1995,  8245900, 4209525, 4036375),
        ('埼玉県', 2000,  6938006, 3500224, 3437782),
        ('東京都', 2000, 12064101, 6028562, 6035539),
        ('神奈川県', 2000,  8489974, 4308786, 4181188),
        ('埼玉県', 2005,  7054243, 3554843, 3499400),
        ('東京都', 2005, 12576601, 6264895, 6311706),
        ('神奈川県', 2005,  8791597, 4444555, 4347042),
        ('埼玉県', 2010,  7194556, 3608711, 3585845),
        ('東京都', 2010, 13159388, 6512110, 6647278),
        ('神奈川県', 2010,  9048331, 4544545, 4503786),
        ('埼玉県', 2015,  7266534, 3628418, 3638116),
        ('東京都', 2015, 13515271, 6666690, 6848581),
        ('神奈川県', 2015,  9126214, 4558978, 4567236)
    ]
    cur.executemany('INSERT INTO populations VALUES (?,?,?,?,?)', populations)
    con.commit()
    con.close()


if __name__ == "__main__":
    setup_database()
    app.run(debug=True)
sqliteにもWebアプリ制作にも慣れていないので非常に非効率でコードが長くなることをやってしまっているような気がします…
フロントエンド
<!DOCTYPE html>
<html lang="en">
<head>
  <meta charset="UTF-8">
  <meta name="viewport" content="width=device-width, initial-scale=1.0">
  <title>Example</title>
  <script src="https://code.jquery.com/jquery-3.5.1.min.js" integrity="sha256-9/aliU8dGd2tb6OSsuzixeV4y/faTqgFtohetphbbj0=" crossorigin="anonymous"></script>
  <script src="https://cdnjs.cloudflare.com/ajax/libs/d3/5.16.0/d3.min.js" integrity="sha512-FHsFVKQ/T1KWJDGSbrUhTJyS1ph3eRrxI228ND0EGaEp6v4a/vGwPWd3Dtd/+9cI7ccofZvl/wulICEurHN1pg==" crossorigin="anonymous"></script>
  <script src="https://cdnjs.cloudflare.com/ajax/libs/c3/0.7.20/c3.min.js" integrity="sha512-+IpCthlNahOuERYUSnKFjzjdKXIbJ/7Dd6xvUp+7bEw0Jp2dg6tluyxLs+zq9BMzZgrLv8886T4cBSqnKiVgUw==" crossorigin="anonymous"></script>
  <link rel="stylesheet" href="https://cdnjs.cloudflare.com/ajax/libs/c3/0.7.20/c3.css" integrity="sha512-GQSxWe9Cj4o4EduO7zO9HjULmD4olIjiQqZ7VJuwBxZlkWaUFGCxRkn39jYnD2xZBtEilm0m4WBG7YEmQuMs5Q==" crossorigin="anonymous" />
</head>
<body>
  <form onsubmit="return false;">
    <select name="variable" onchange="changeHandler(this)">
      <option value="population">人口(男女計)</option>
      <option value="population_male">人口(男性)</option>
      <option value="population_female">人口(女性)</option>
    </select>
  </form>

  <div id="chart"></div>

  <script>
    let data = {{ default_value | safe }};
    data = add_tooltip(data);
    let chart= c3.generate(data);

    function add_tooltip(data_for_c3) {
      // python側からd3.formatを書く方法がわからなかったので暫定的にこっちで処理
      data_for_c3['tooltip'] = {format: {value: function(value){return d3.format(",.0f")(value)}}};
      return data_for_c3;
    }

    function changeHandler(input_value) {
      const value = $(input_value).serialize();
      $.ajax("/show", {
            type: "post",
            data: value,  // POSTでサーバーに送信するデータ
            dataType: "json",
          }).done(function(response) { // 成功した場合実行される
            console.log("Ajax通信 成功");
            // POSTリクエストの結果を受け取ってHTMLを書き換える
            let new_value = JSON.parse(response.values);
            new_value = add_tooltip(new_value);
            chart= c3.generate(new_value);
          }).fail(function(data) { // 失敗した場合実行される
            console.log("Ajax通信 失敗");
      });
    }
  </script>
</body>
</html>
こういうものを作るのに慣れてくればダッシュボードを自前で作ったりできそうですね
細部をカスタマイズしたいとかの要件がなければ、簡単にダッシュボードを作れるツールやライブラリを使ったほうが早いでしょうけど…